
Causal blueprints as organizational memory
Merchandising teams repeat the same decisions every season, yet they rebuild their analyses every time. The opportunity is to turn recurring decisions into reusable blueprints so decision makers can compound learnings across seasons, rather than starting from scratch each instance.
Historical patterns are useful guides in merchandising. They tell you what has tended to work, what has tended to fail. But merchandising is not primarily a function that reads the business. It writes the business. It changes the system. It shapes what exists, where it sits, how it is experienced and what constraints the business is willing to accept. It makes a set of choices and then commits the organization to live inside them for months.
Which is why we should be thinking about the function as inherently intervention based. Most product assortment analysis today looks at “what happened?”, but what the teams are really needing to know is “what would happen if we do this?”
For many enterprise merchandising teams, planning suites exist, but Excel remains the last-mile decision layer. Some are using models that can describe patterns in historical data. These can be excellent forecasting engines too, as long as the future behaves roughly like the past.
But merchandising decisions are interventions. They change the conditions.
Correlations, forecasting or predictive ML models can be useful, but only up to the boundary where it assumes continuity. When you change elements of the system, you need a way to reason about interventions and counterfactuals.
This is where causal AI comes in. Causal AI consists of both an underlying structure and a toolchain. The structure is the explicit causal blueprint that maps the drivers and levers of a particular problem. The toolchain is the set of methods and analytical tools that use the blueprint to estimate the impact of interventions and run scenario modeling.
It's a step forward from pure correlation, so we can understand why outcomes happen and how to change them. We can use causal factors to run simulations and what-if analyses that produce more transparent, trusted recommendations.
Why causal AI and ML belong together
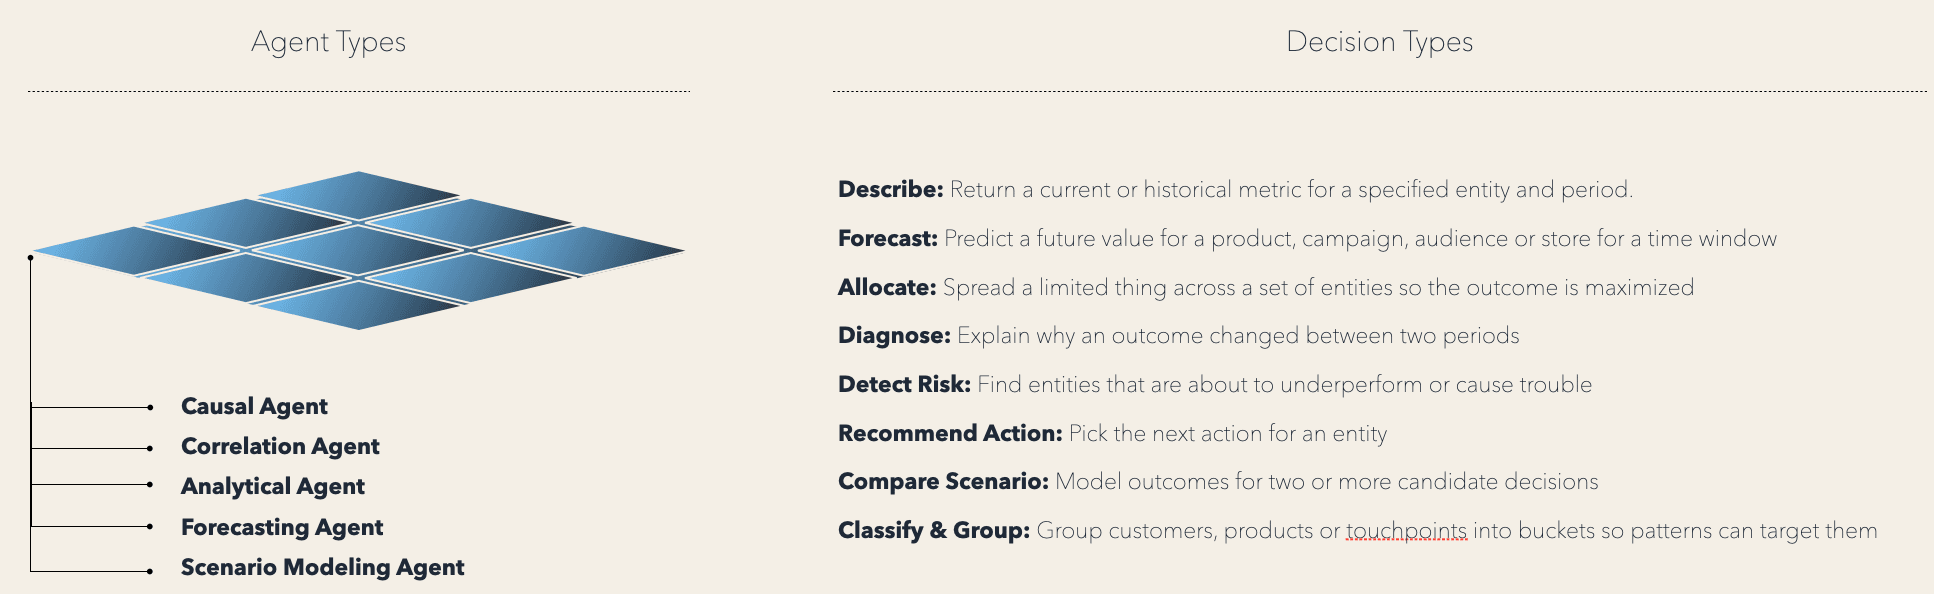
Causal AI is not always feasible or identifiable in isolation. Pairing causal AI with other ML approaches is how you make robust decisions. Predictive and analytical models can still describe performance, forecast demand, detect risk and group products or cohorts. Causal AI sits above these as a decision scaffold that makes assumptions explicit and estimates the impact of interventions.
If causal AI is only as good as the causal structure it runs on, then the most important work happens upstream of any modeling. The rest of this post walks through how we turn recurring assortment decisions into a reusable blueprint.
Finding your decision infrastructure
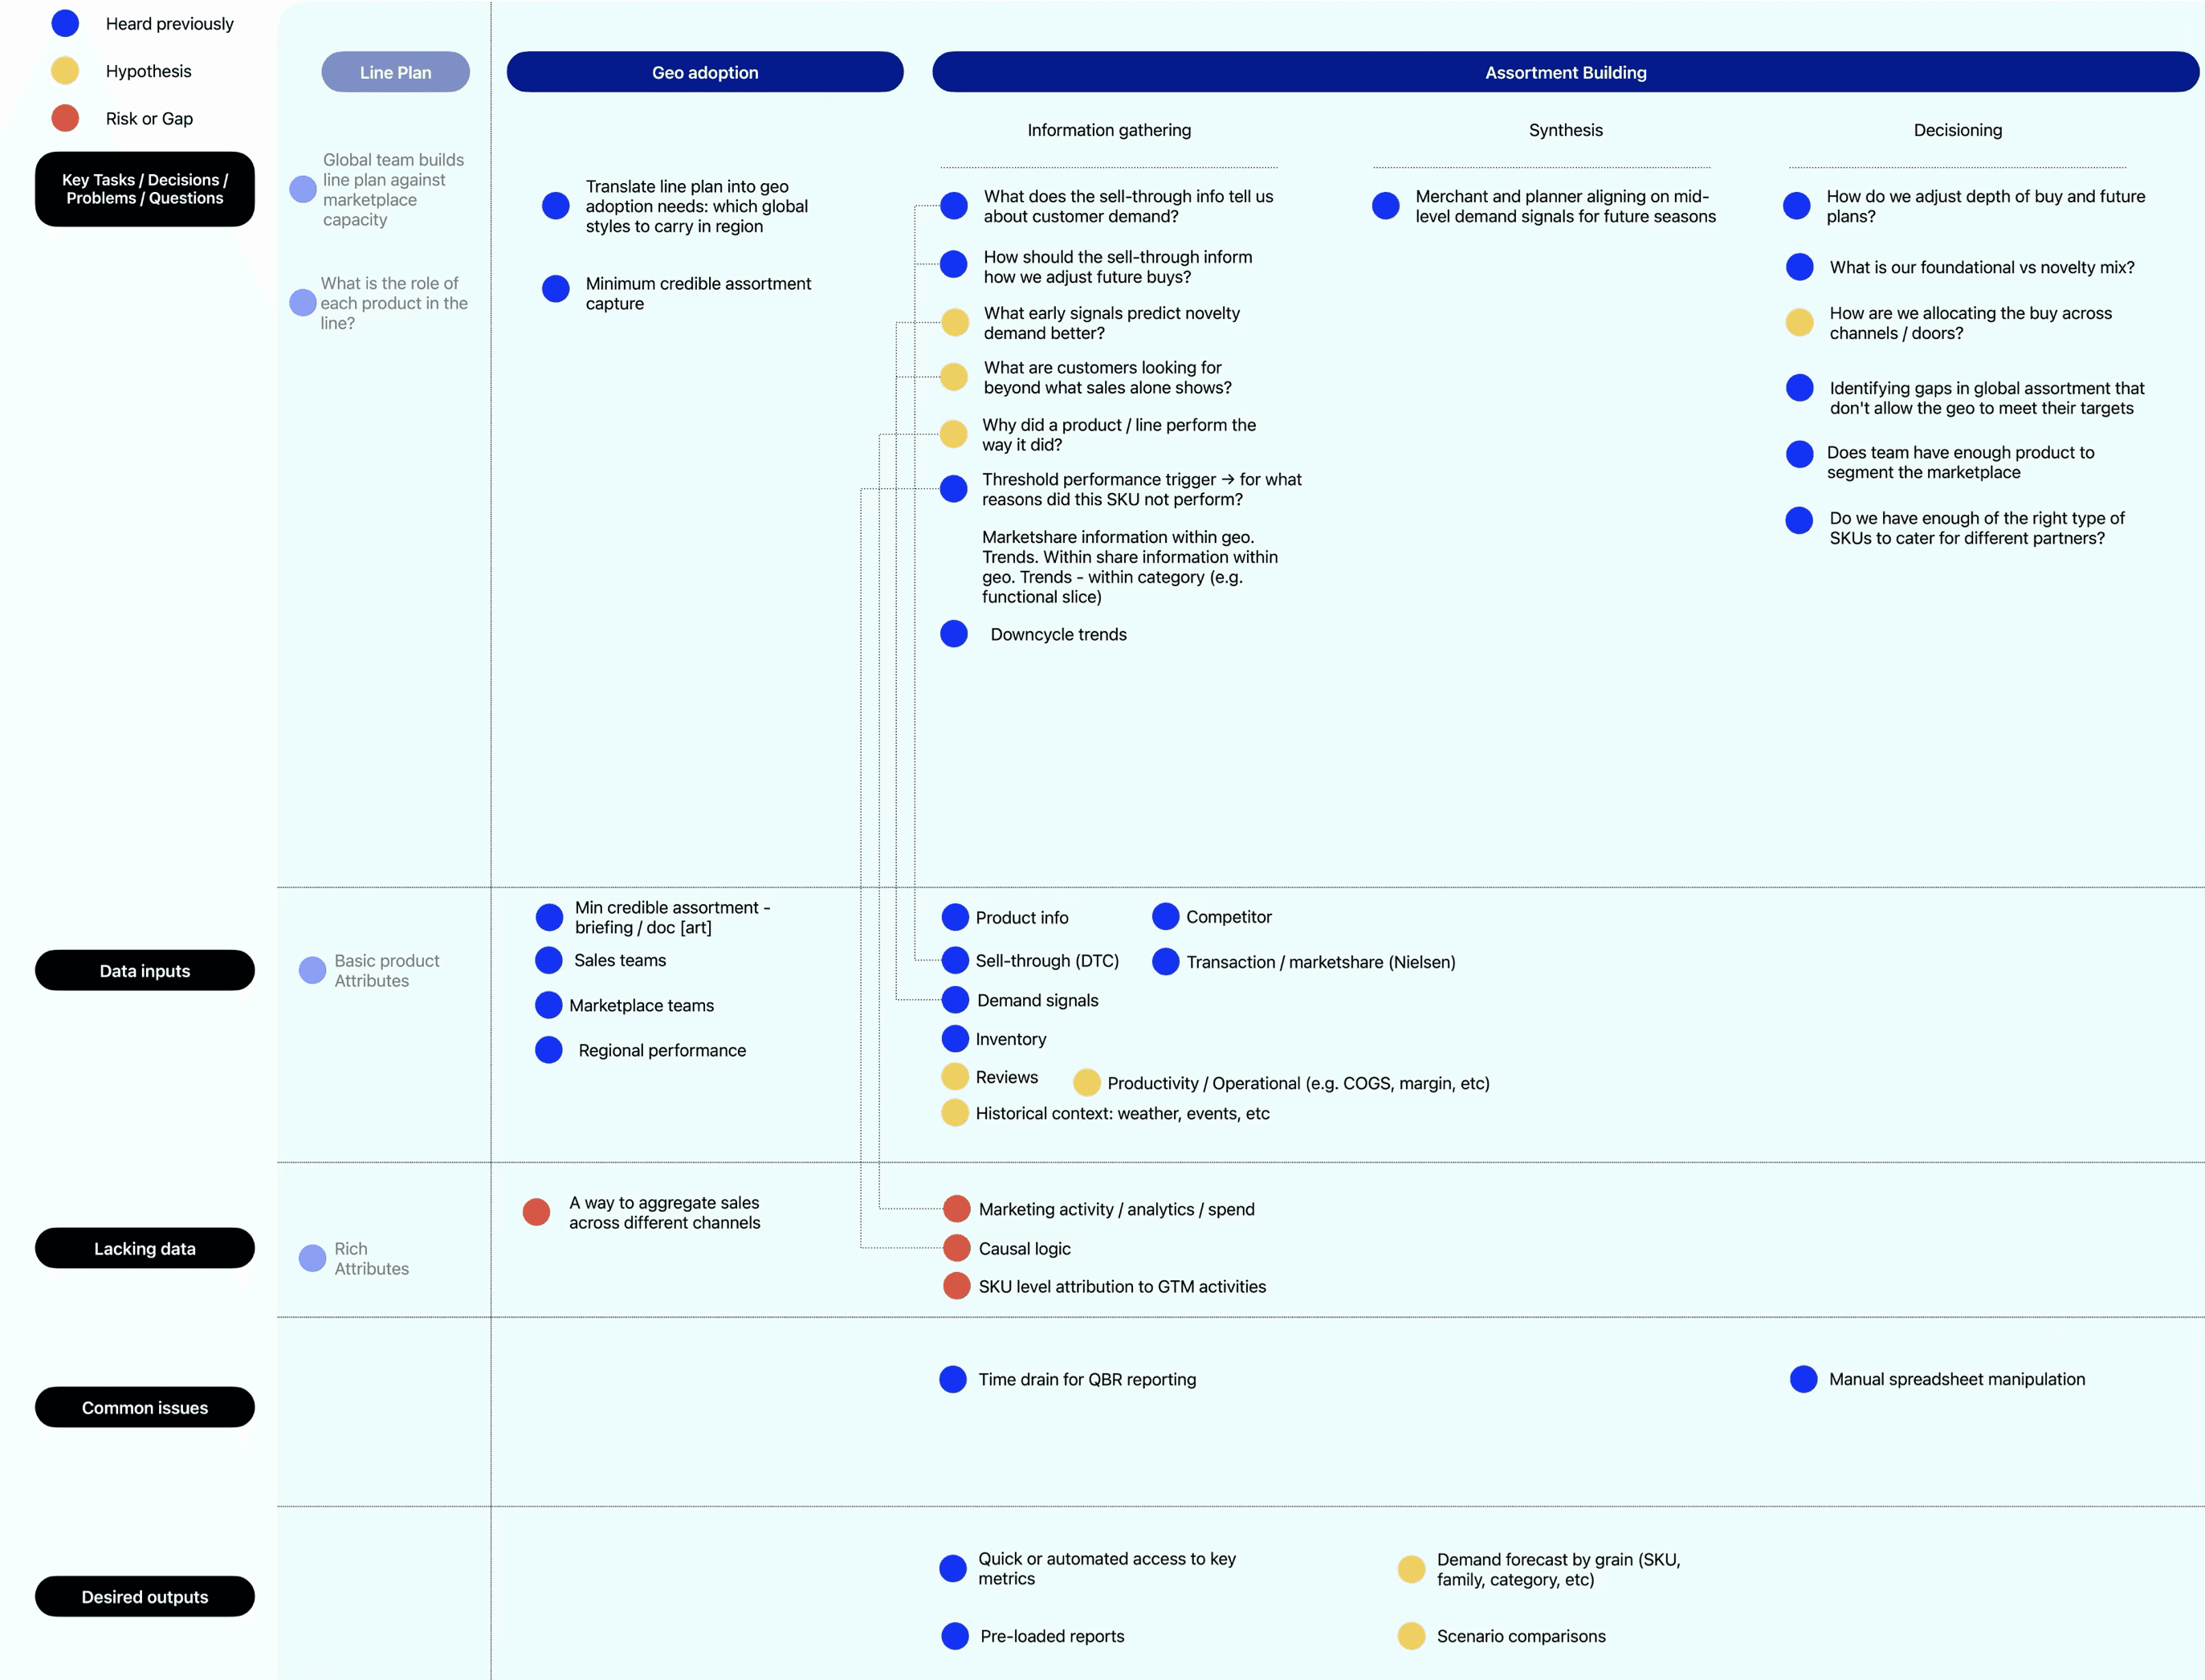
We start by understanding and mapping all questions, problems and decisions that occur throughout the assortment lifecycle on an Assortment Decision Canvas. The purpose of this is to get a holistic picture of the problems and questions that are commonly solved for, then prioritize the most important of those to focus on.
We connect those identified problems to the required data to solve them, common issues and desired outcomes.
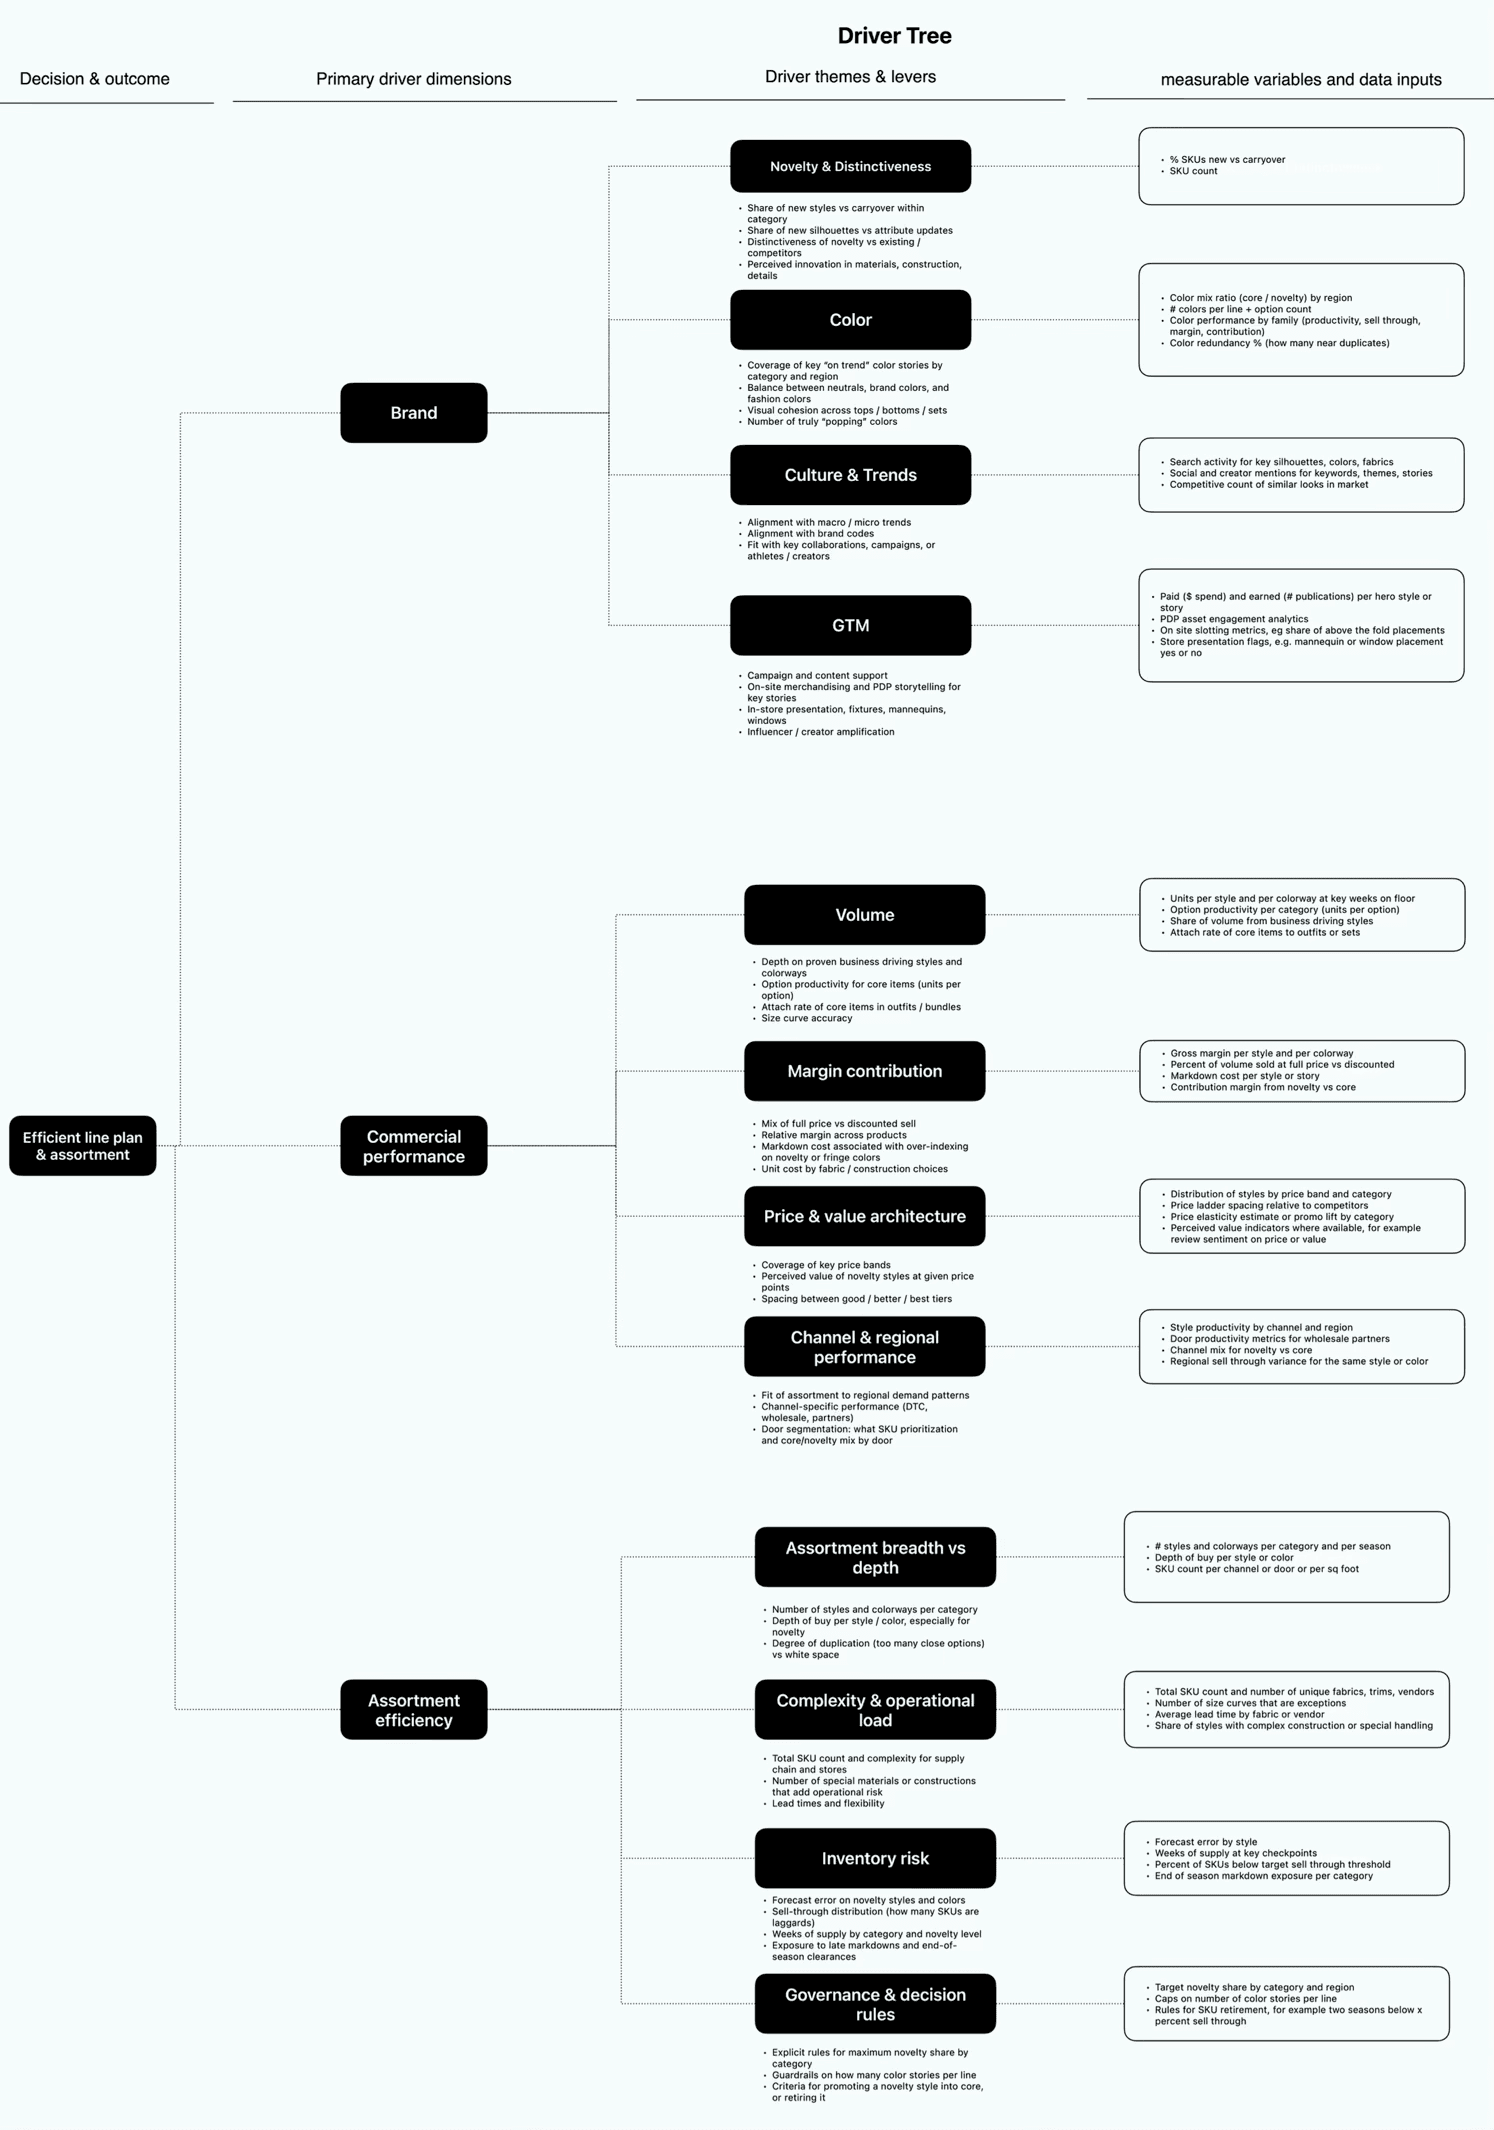
We then take each of those key decision territories and build a Driver Tree. This explodes each decision into its component parts and unpacks how we should be thinking about the problem and where to find the necessary data.
Let’s take a relatively complex but common problem to use as an example:
“For a given season /category / region, what mix of core vs novelty and what color architecture, allows us to maintain baseline demand (hitting revenue, margin and inventory targets) while providing brand and product distinctiveness, within our SKU and operational constraints?”
There’s a lot to unpack in that.
At the highest level of the tree we capture the essence of the decision. For example, ‘efficient line plan and assortment’.
We can then chunk it into the primary driver dimensions that influence the outcome. For this example, I’ve captured those as ‘brand’, ‘commercial performance’ and ‘assortment efficiency’.
Next, we break down each of those drivers by the key themes or levers within. For example, within Assortment Efficiency, those key levers are:
Assortment breadth and depth
Complexity and operational load
Inventory risk
Governance and decision rules
Once we’ve extracted those levers, we define the measurable variables and data inputs connected to each one. This is the most granular level of the tree and should be highly specific.
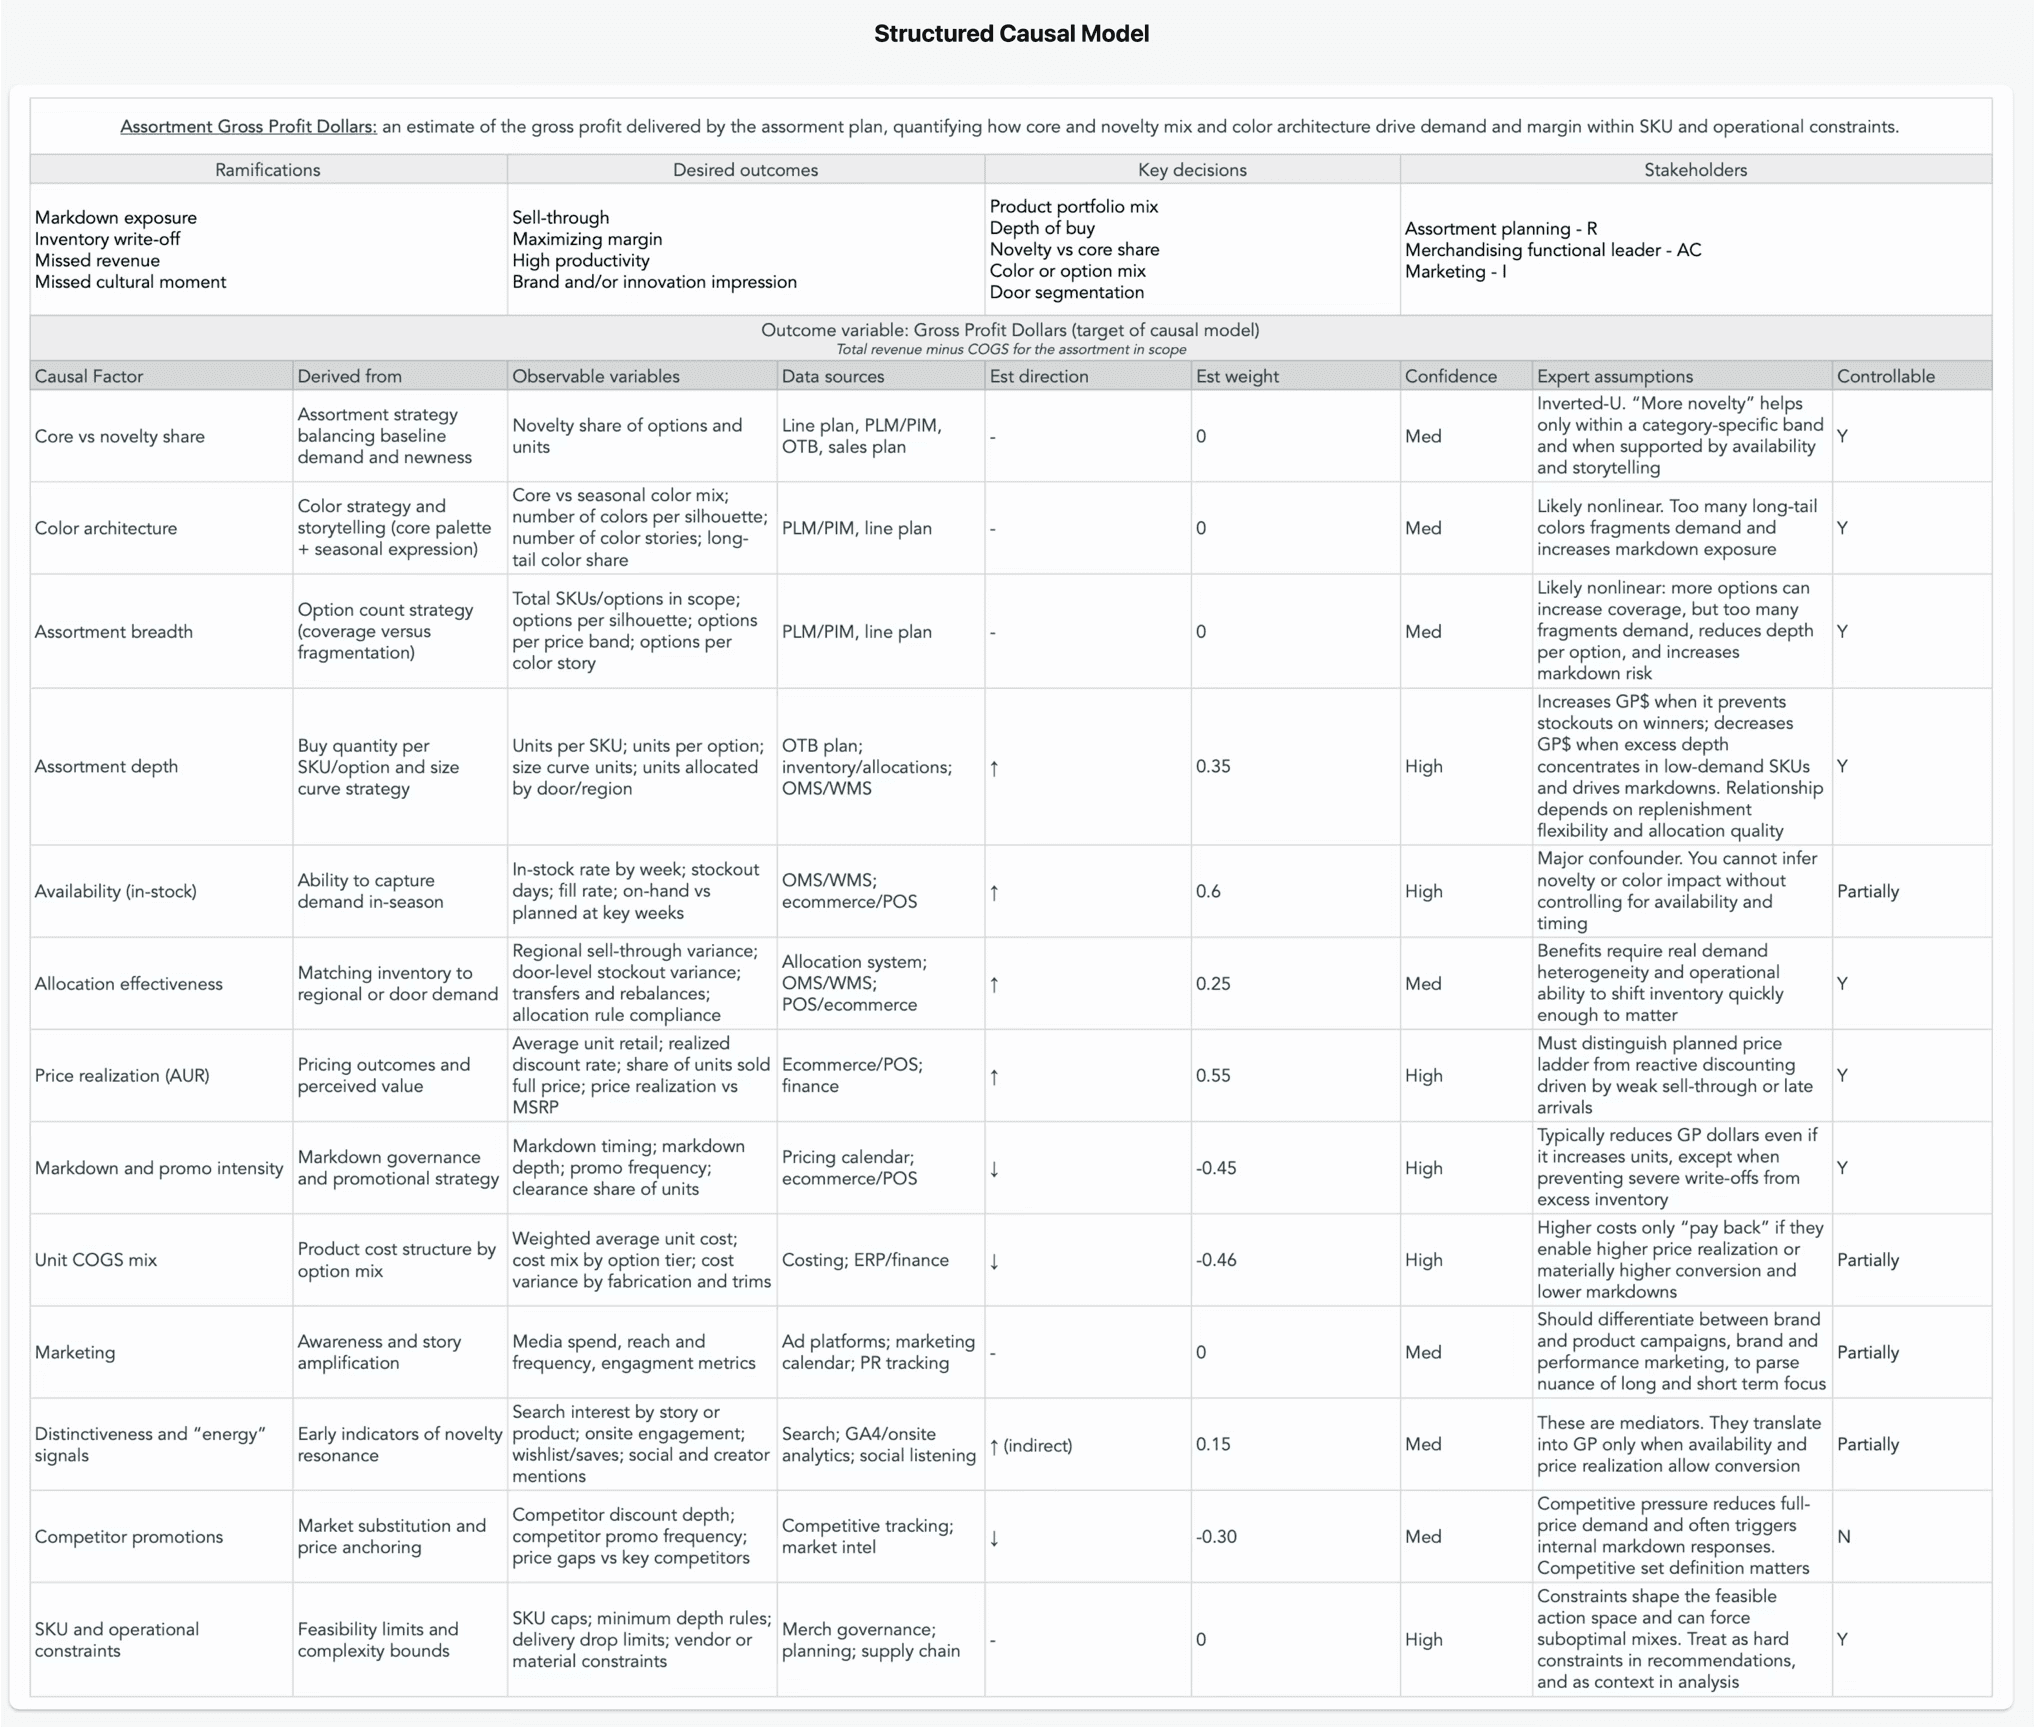
Next, we translate the Driver Tree into a Structured Causal Model (SCM), where we map assumed cause-and-effect relationships. The purpose of an SCM is to turn a loose set of “drivers” into an explicit causal hypothesis that can be tested and operationalized. It forces clarity on what we believe is upstream vs downstream, which relationships are likely direct or mediated and which levers are actually controllable.
It requires deep domain expertise and familiarity with the decision territory. This is a good moment to bring in stakeholders to forge alignment behind OKRs, because the SCM becomes the shared logic that the causal system will use to prioritize evidence, run scenario analysis and ultimately recommend interventions. If the team is misaligned here, the model will only reinforce disagreement.
The SCM defines the outcome variable, which is the single business result the blueprint is trying to explain and improve (in this example, it is Assortment Gross Profit Dollars). It’s worth noting that GP$ is the headline outcome variable in this example, but in practice the blueprint captures the full decision context. It defines ramifications, desired outcomes, key decisions, and stakeholders. This is important because we are not modeling a metric in isolation and we can shape what “good” actually means (sell-through, markdown exposure, availability, channel commitments, brand priorities, and operational constraints).
Then each causal factor is broken out and detailed: how it is derived conceptually, how it could be observed in data, what sources it comes from, the expected direction and shape of its effect and the confidence we have in that assumption today. We also explicitly mark what is controllable, which prevents the blueprint from devolving into a wish list.
Practically, this is where the blueprint becomes durable “decision memory.” It captures the causal flow, making it legible enough to reuse and improve over time.
The SCM becomes the foundation for a Causal Map, which is simply a visual representation of the main elements in the decision territory and how they relate to each other. Its purpose is to help see the system at a glance for identification of issues and quick stakeholder alignment.
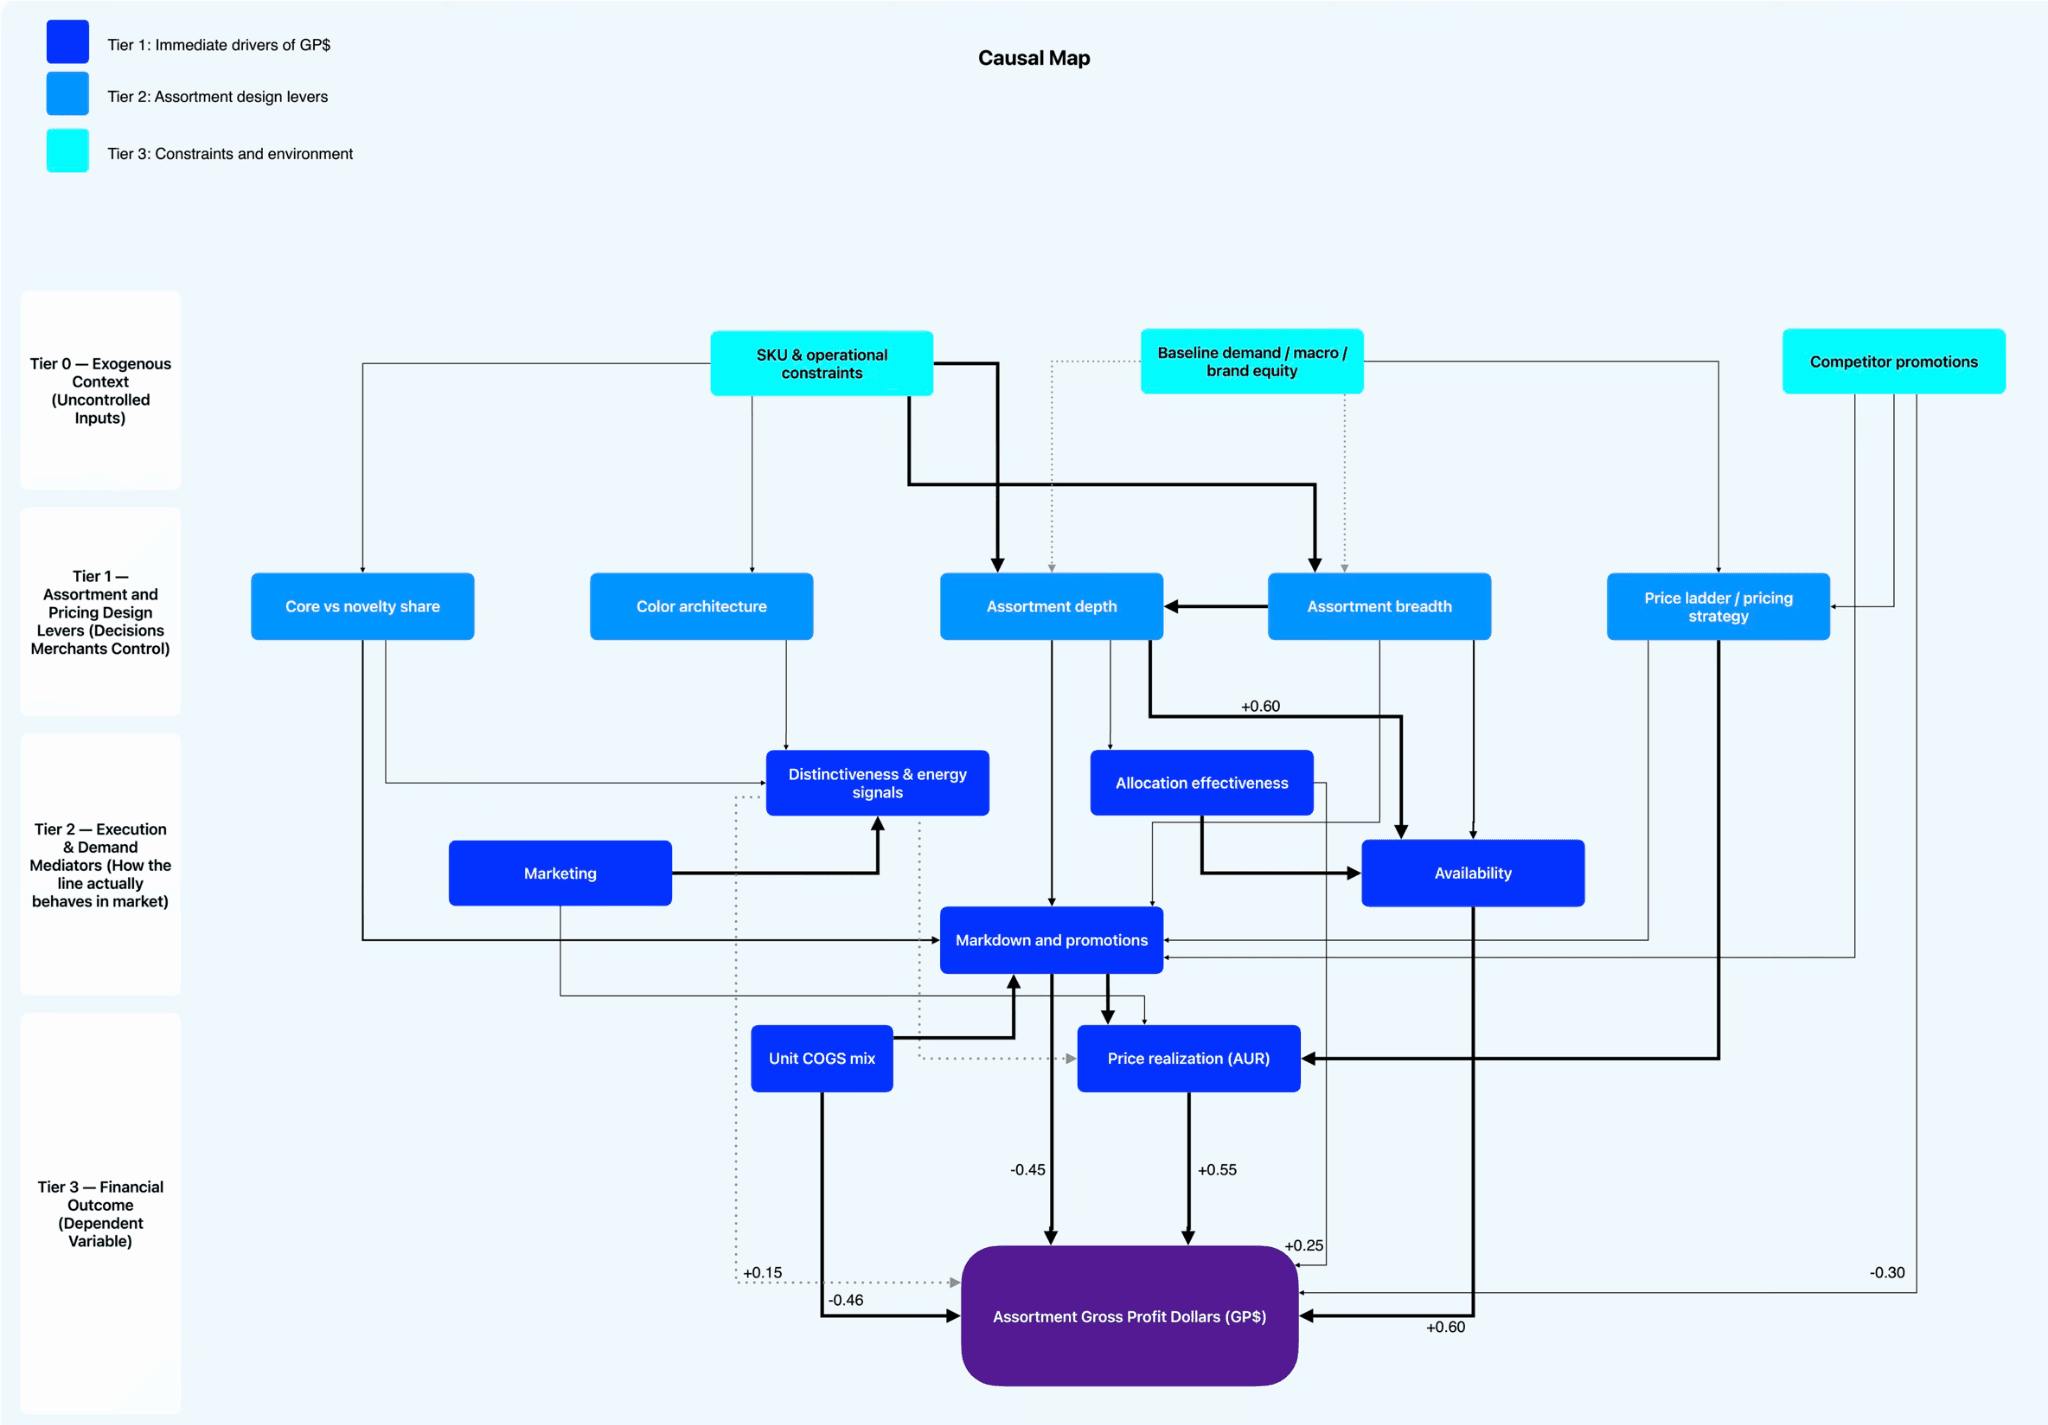
In this example, we’ve broken down the causal map into four tiers:
Tier 0: Exogenous Context
Tier 1: Assortment and Pricing Design Levers (Decisions Merchants Control)
Tier 2: Execution & Demand Mediators (How the line actually behaves in market)
Tier 3: Financial Outcome (Dependent Variable)
From there, a data scientist translates that map into a Directed Acyclic Graph (DAG). A DAG turns a causal story into a structure that can be tested: relationships are explicit and directional, whilst variables are defined precisely enough to connect to data. In practice, not every decision territory will yield a clean causal estimate from observational data alone. When the data supports it, we can quantify directional effects with meaningful confidence. When it does not, we treat the model as a scenario with ranges that outline levels of confidence or uncertainty.
Once you have a DAG set up, causal AI tooling can do what it is designed for: estimate the impact of interventions and run “what-if” scenarios under real constraints. It is the decision scaffolding upon which you can layer a set of ML and causal “specialist” agents. ML still plays an important role, especially for forecasting baselines, detecting risk and surfacing patterns.
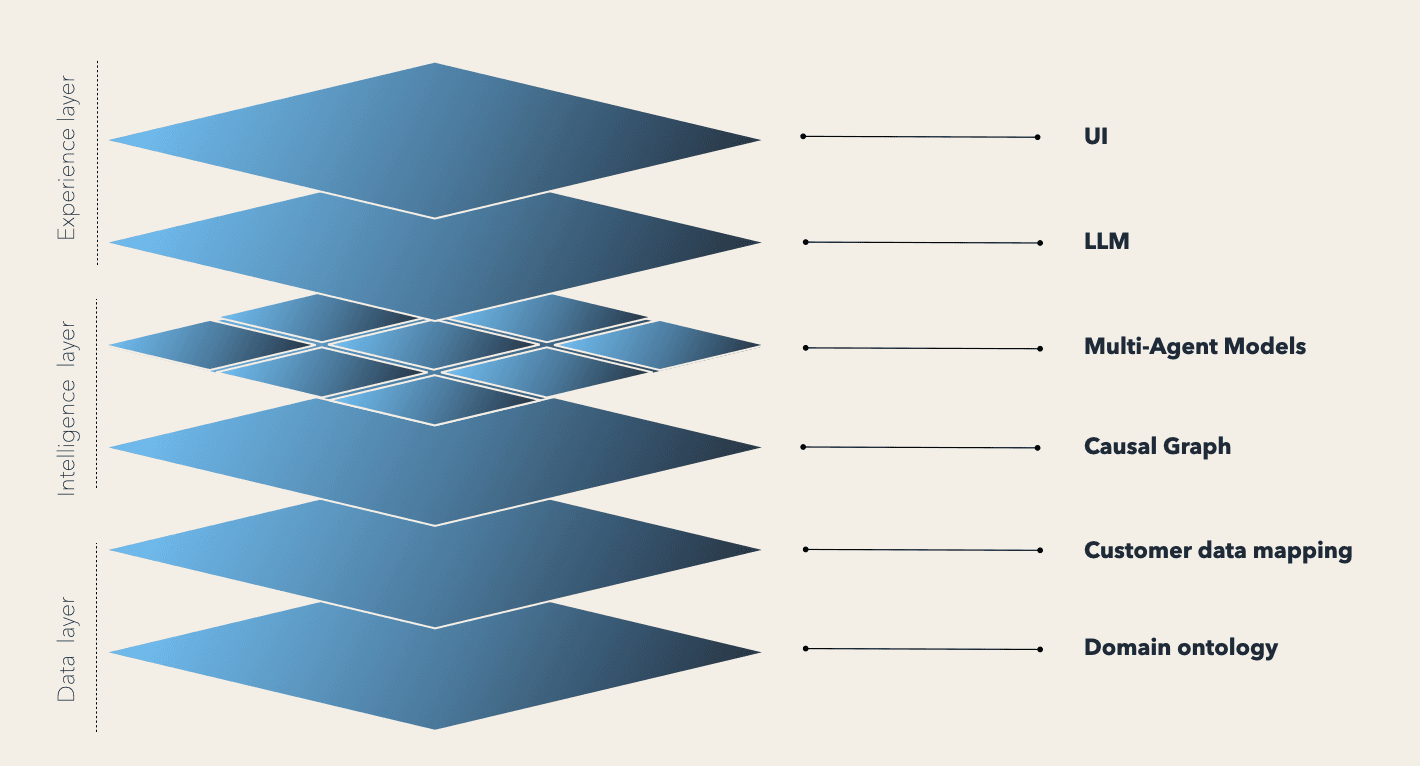
All of that underlying logic and tooling has to be accessible to assortment teams, not just data scientists. Wrapped in an interface with a UI and natural-language layer that lets merchandising teams ask a question in their own terms, see the recommendations and understand the rationale or trade-offs.
Traditionally, merchandising teams have not been able to compound learning in a systematic way. Each cycle was a fresh assessment, because the underlying “why” was never a shared asset. This is why merchandising has often defaulted to historical comparisons, because precedent was the closest thing most teams had a defensible causal model.
If this resonates, we are looking for a small number of pilots or design partnerships to apply causal blueprints to one or two real decisions you need to make in an upcoming season. We typically start with a working session to map one decision territory and assess the data already available, then scope a pilot based on your objectives, constraints and timelines. We'll start by building the blueprints and delivering decision-ready outputs, then move into tooling only where it is clearly warranted for your team.
