
From personas to patterns: rethinking segmentation
Despite all the advances in tools and data, segmentations are still often treated as a one-off deliverable that are suspended in time. Rigid, reductionist and quickly outdated. Too often, they’re either too simplistic to spark creativity, or too abstract to guide real decisions. Others are rich in insight but commercially disconnected. The sweet spot is segmentations that are both deeply insightful and commercially rigorous.
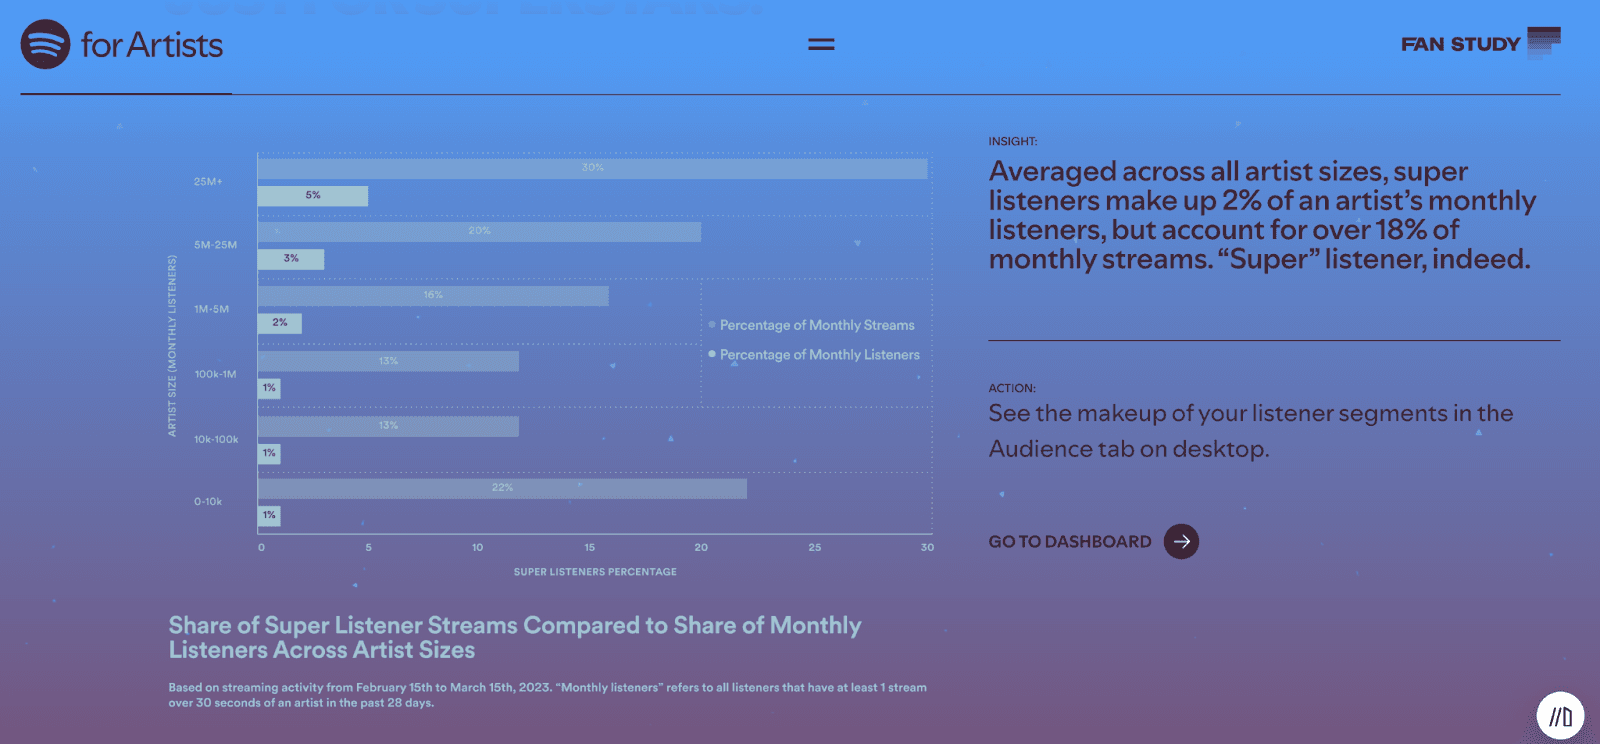
Around ten years ago or so, some brands began the shift from static segments to live, behavioural-driven clusters. Netflix’s ‘taste communities' was one of those pioneering the move, with thousands of algorithmically clustered viewer groups that are the backbone of its recommendation engine. Spotify continues such deeply behavioural segmentation, seeing their users by criteria like ‘engagement depth’ that help Artists focus on scaling the right types of fans.
With advances in data infrastructure, AI and Machine Learning, it’s possible to create segmentations that reflect how people actually behave, what drives their choices and how those patterns shape business outcomes.
What should segmentation really do?
At a base level, segmentation should identify meaningful groups of customers. But the effective ones do much more than that, they reveal how people make decisions.
Classic segmentation models often assume customers make clean, rational choices. But real decision-making is far messier. It’s shaped by social cues, cultural codes, peer behaviors and personal identity. This is where a more ethnographic approach can be valuable. It uncovers outliers. The specific, strange, emotionally loaded behaviors that more traditional qual and quant data often misses. These are the human truths that help brands avoid the trap of flattening people into lifeless abstractions. Of course, ethnography has its trade-offs. Traditionally, it was slow and expensive with the risk of being highly context-dependent and hard to extrapolate. Newer methods and tools that allow for more lightweight digital ethnographies (e.g. mobile diaries) have had a dramatic impact on time and cost. But there’s room for even more improvement when layered with scaled behavioral data and social signals.
Bridging what matters to audiences with what matters to businesses.
Even the richest ethnographic insight leads you straight into a familiar problem: now that you’ve identified a handful of interesting segments, which ones do you actually bet on? Because you can’t target everyone with equal intensity. Which ones get the media dollars? Which should influence the product roadmap? Without a commercial lens, it's guesswork.
This is where most segmentation work stops short. It gives you a set of audience portraits, but no clear direction on which one deserves priority. For this, you need to understand not just who they are, but what they contribute. Who are the audiences that buy often? Who buys at scale? Who buys once but never returns? Quantifying value forces clarity, giving a rational basis for creative and strategic decisions.
The tools and techniques at our disposal
Luckily, we don’t have to choose between deep insight and hard metrics. With the right approach and the right tools, you can combine both.
Knowledge Graphs
A knowledge graph is a structured network that connects concepts. This is done not just by category, but by meaning.
Think of it less like a database, more like a map. You can link purchase behavior with campaign exposure, cultural trends, customer sentiment, or externalities like weather events. By layering signals together, you can see patterns that provide a more dynamic view of your customer base. Not as fixed personas but as evolving, connected cohorts.


Source: Neo4j
These graphs don’t define segments on their own, but they help contextualize data in a new way. With a well-designed knowledge graph, you can:
Link purchases to the social or cultural cues that preceded them
Spot relationships between product types and behavioral mindsets
Detect the influence of an editorial moment, a niche community, or a creative campaign
This is where knowledge graphs begin to echo the spirit of ethnography. They surface the emotional and cultural layers beneath behavior (side note: that nuance only shows up if your schema is set up well, with the taxonomy naming the right concepts and the NLP tagging them consistently). Knowledge Graphs have the added benefit of scale and update frequency compared to qual. Together, the human and machine combo is a powerful one.
When niche communities or emerging behaviors are surfaced in qual (like a focus group participant mentioning a niche cultural trend), we need to ask “is this an anomaly or an insight that has scale?”. This is where Knowledge Graphs and modern clustering techniques can help. By layering first-party behavioral data, search signals and cultural data, Knowledge Graphs allow you to trace how widespread that behavior is, whether it's part of a larger trend and how it's connected to other concepts or cohorts. Think of it as a way to pressure-test the insight. Are people who exhibit the behaviors of that niche movement also engaging with specific product categories? Are there spikes in related terms on TikTok or Pinterest? Are these customers high-value or high-churn? A Knowledge Graph can show how a segment fits into the wider behavioral network.
Stitch Fix provides a good example of qualitative input and training data working in tandem on fast moving cultural cues (fashion trends). Human stylists annotate the subtle cues of a great outfit (mood, occasion, silhouette), then feed those labels into an outfit-quality model that updates every day. Stitch Fix’s ‘experts-in-the-loop’ approach is not a Knowledge Graph, yet it is illustrative of qualitative human insight injecting contextual intelligence into a Machine Learning that has had demonstrable commercial impact.
RFM and Commercial Logic
At some point, your research needs to meet commercial realities. That's where RFM analysis comes in.
RFM (Recency, Frequency, Monetary) is a way of applying commercial rigor to segmentation. It scores customers based on how recently they’ve purchased, how often they buy, and how much they spend. You can apply it up front to spot valuable cohorts early in your research, or after qualitative segmentation to validate and prioritize. The order depends on your context and your data.
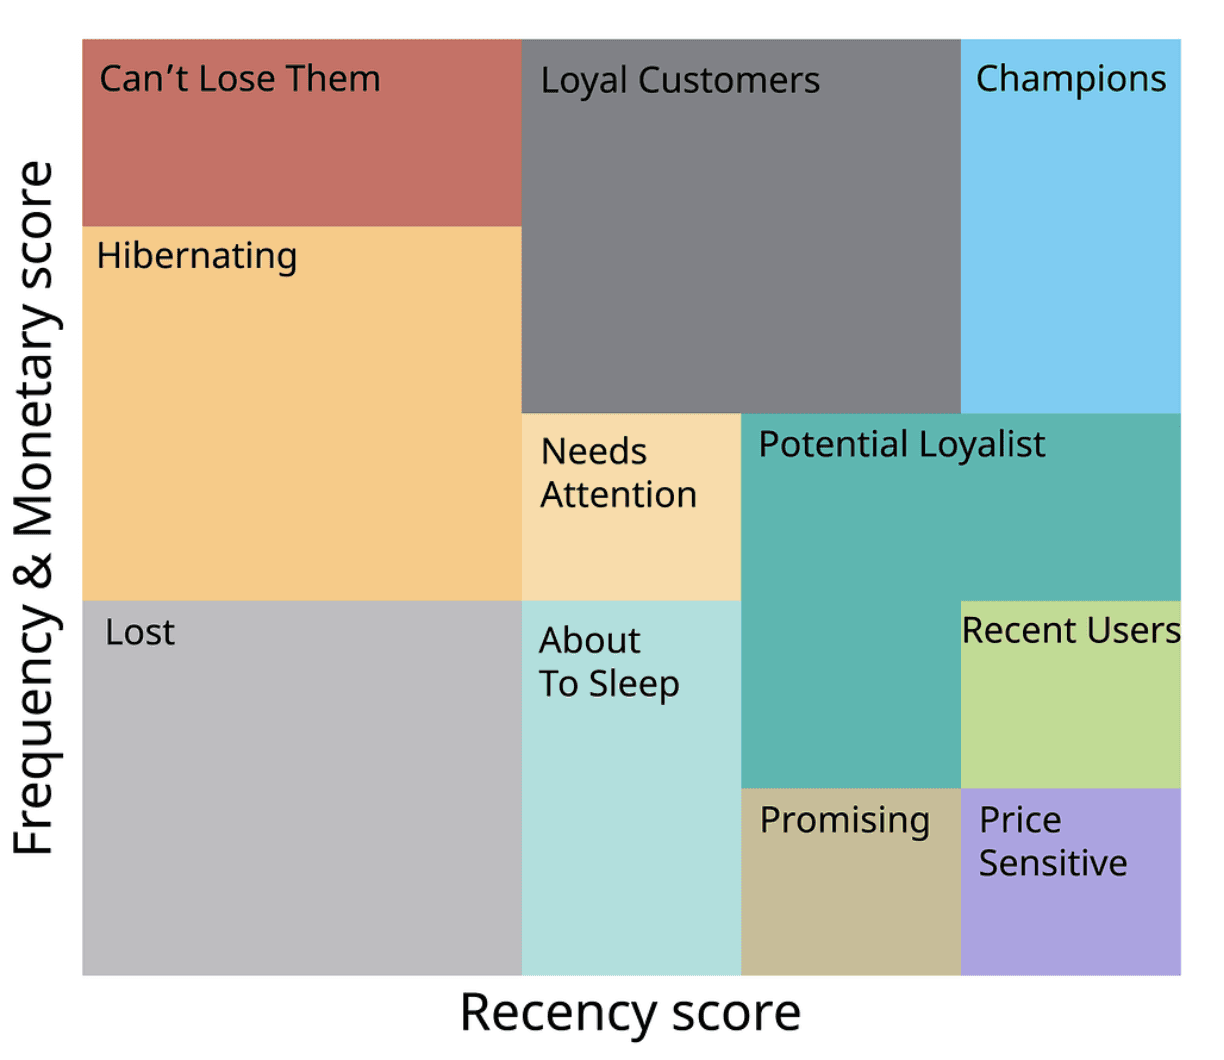
Source: Datalab
RFM helps you identify where the growth can come from. It allows you to understand the revenue contribution of each segment and how much of your customer base they represent. You can quantify on a dollar to dollar basis, which cohorts are driving your business today and which ones show signals of future value. Sephora’s Beauty Insider tiers are a textbook example: roughly 20% of shoppers generate about 80% of revenue and boost cross-sell by over 20%.
It won’t tell you everything. It’s backward-looking and doesn’t account for things like acquisition cost or future intent. However, it can ground your decisions in commercial reality. Adding margin, CLV, or CAC payback is a best-practice enhancement when you need commercial precision. Combine it with market sizing, lookalike modeling or propensity scoring, and it becomes a powerful prioritization tool, especially when exploring newer segments or products.
How this comes to life
Let’s say you’re a sporting goods company, a supplements business or a skincare brand. Whatever takes your B2C fancy.
You start with foundational first-party data: purchase history, product categories, site behavior and campaign interactions. You enrich that foundation by building a knowledge graph that brings together multiple layers:
Structured product metadata
Campaign themes and creative hooks
External signals (e.g. niche Discords mentions, Substack topics, weather, spikes in review language, visual Pinterest patterns, research citations, geo-tagged movement trends)
Additional first-party attributes (e.g. bundling behavior, referrals, customer satisfaction scores, customer service tickets, returns data)
Second-party retailer sales or search data
A knowledge graph connects the dots, tracing relationships between creative hooks, cultural moments, customer sentiment and behavioral patterns.
This runs in tandem with qual. The ethnography, interviews or field observations which gives richness and direction to the segment definitions. The knowledge graph extends that work by tracing those patterns at scale, revealing which motivations surface repeatedly across your base. For example, one segment might rally around sustainability narratives; another may emerge from performance-focused subcultures.
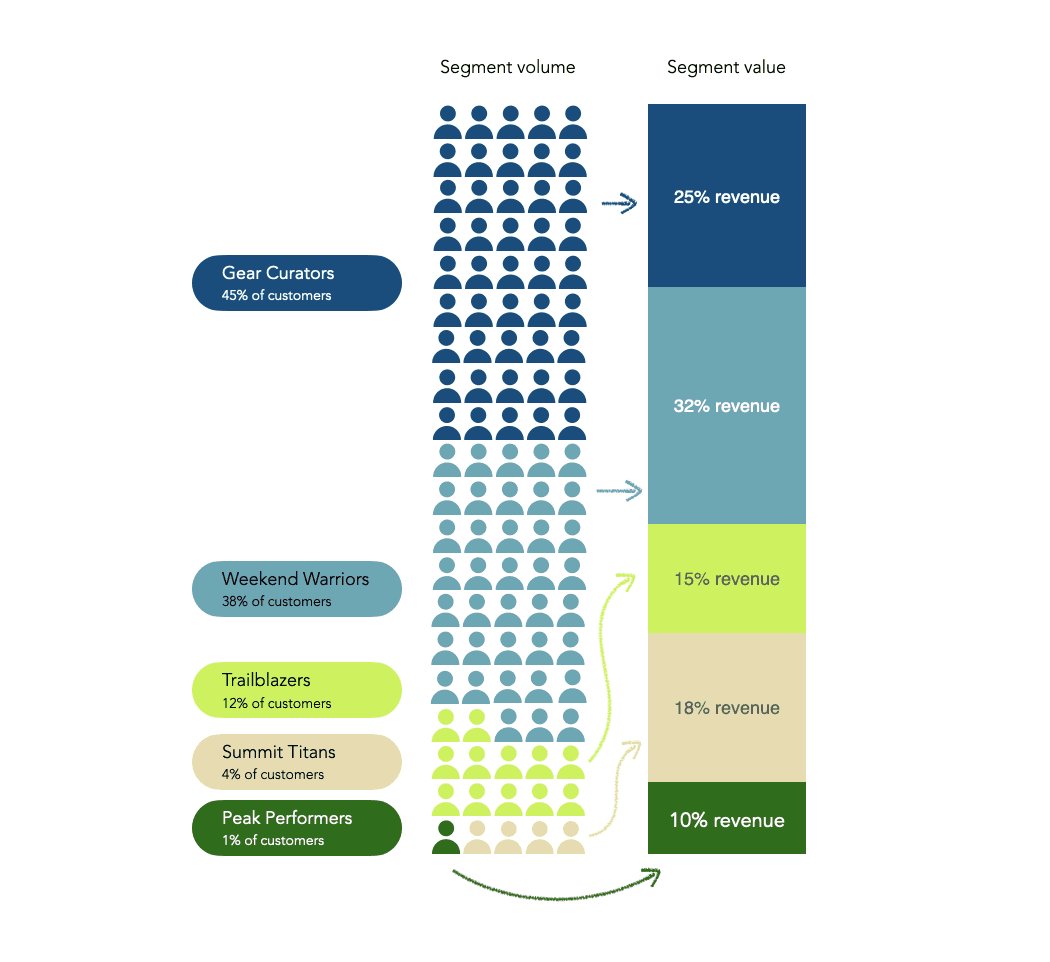
To build the segments, take the graph embeddings and cluster to identify natural groupings of customers who share similar contexts and behaviors. Then name those in useful ways that can be applied. Once those segments are mapped and labeled, you run RFM on each. That’s what lets you understand their contribution and prioritize. You might find that a small segment makes up the majority of your revenue. Or that the bulk of your marketing efforts have been targeted to an audience that barely moves the needle.
Segment definitions emerge through an interplay of qualitative insight (ethnography, interviews) and scaled pattern recognition (knowledge graphs, clustering, RFM). In some cases, you start with behavior. In others, you start with belief. The right sequencing depends on your data maturity and objectives.
Redefining value
Segmentation should be a strategic asset, not a static deliverable. No segmentation will ever capture the full messiness of human behavior. But when it connects insight with impact, it becomes one of the most powerful tools for focused growth and resonant storytelling.
